Track Your Reading Journey: The Complete Guide to Readima's Dashboard and Analytics
Discover how Readima's reading dashboard helps you understand your reading habits with detailed analytics. Track articles read, words consumed, time spent, reading speed trends, and see exactly how much time you're saving.
Why Track Your Reading?
In a world where we consume thousands of words daily, understanding your reading habits is powerful. Are you reading more this week than last? Is your speed improving? How much time are you actually saving with speed reading techniques?
Readima's Reading Dashboard answers all these questions with beautiful, actionable analytics.
The Reading Overview Dashboard
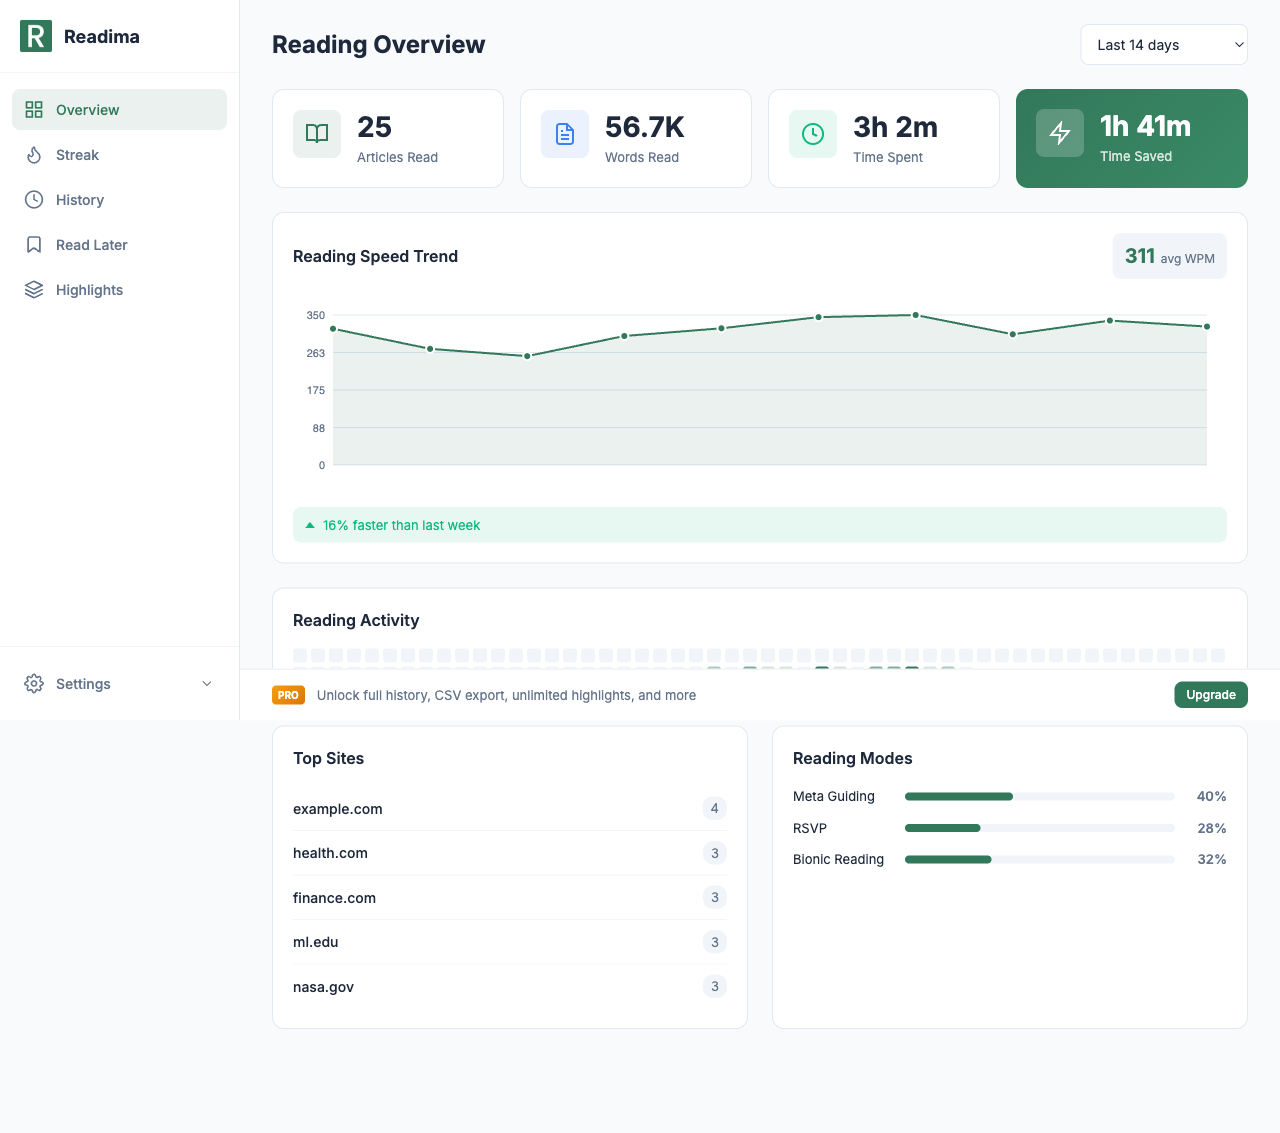
When you open Readima's dashboard, you're greeted with four key metrics that summarize your reading activity:
Articles Read
Track the total number of articles you've consumed. Whether it's news, research papers, or blog posts, every piece of content counts toward your reading goals.
Words Read
See the exact number of words you've processed. This metric helps you understand your true reading volume — some articles are 500 words, others are 5,000. Word count tells the real story.
Time Spent
Know exactly how much time you've invested in reading. This includes active reading time across all websites where you've used Readima.
Time Saved
This is the magic number. Readima calculates how long your reading would have taken at an average 200 WPM pace, then compares it to your actual reading time. The difference? That's time back in your day.
Users save an average of 1 hour 41 minutes over a 14-day period using Readima.
Reading Speed Trend
The heart of the dashboard is the Reading Speed Trend graph. This line chart shows your words-per-minute (WPM) over time, helping you visualize your progress.
Key features:
- Average WPM display: See your overall reading speed (e.g., 311 avg WPM)
- Trend line: Watch your speed improve week over week
- Comparison indicators: "16% faster than last week" tells you if you're improving
This data is invaluable for understanding how speed reading techniques are working for you.
Reading Activity Heatmap
Similar to GitHub's contribution graph, the Reading Activity heatmap shows your daily reading patterns:
- Darker squares = more reading activity
- Identify your most productive days
- Spot patterns in your reading habits
- Stay motivated by maintaining streaks
Top Sites
Ever wonder where you spend most of your reading time? The Top Sites panel ranks the websites where you read most frequently:
- example.com — 4 articles
- health.com — 3 articles
- finance.com — 3 articles
- mit.edu — 3 articles
- nasa.gov — 3 articles
This helps you understand your content diet and reading interests.
Reading Modes Breakdown
Readima offers three reading modes, and the dashboard shows which ones you use most:
- Meta Guiding: 40% — Pointer-based reading assistance
- Bionic Reading: 32% — Bold text fixation points
- RSVP: 28% — Rapid serial visual presentation
Understanding your mode preferences helps you optimize your reading strategy for different content types.
Free vs Pro Analytics
Readima offers powerful analytics at every tier:
Free Tier
- Last 14 days of reading activity
- Basic WPM chart
- Article count per day
- Total time spent
Pro Tier ($2.9/month)
- Full reading history (unlimited)
- WPM improvement trends with percentage gains
- Words consumed over time
- Reading patterns analysis
- 90-day date range filter
- CSV export for personal analysis
Using Analytics to Improve
Here's how to leverage your reading data:
Set Baseline Metrics
Before trying new techniques, note your current:
- Average WPM
- Articles per week
- Time spent reading
Experiment with Reading Modes
Try each mode for a week and compare your WPM:
- Week 1: Meta Guiding only
- Week 2: Bionic Reading only
- Week 3: RSVP for long articles
- Week 4: Mix based on content type
Track Progress Over Time
Check your dashboard weekly to see:
- Is your average WPM increasing?
- Are you reading more consistently?
- Which modes give you the best results?
The Stats Cards
At the top of your dashboard, four stats cards give you instant insights:
| Metric | Example | What It Means |
|---|---|---|
| Articles Read | 25 | Total articles consumed |
| Words Read | 56.7K | Total words processed |
| Time Spent | 3h 2m | Active reading time |
| Time Saved | 1h 41m | Time saved vs. average reader |
These cards update in real-time as you read, giving you instant feedback on your progress.
Privacy-First Analytics
All your reading data stays local in your browser. Readima doesn't send your reading history to any server. Your analytics are:
- Stored locally in Chrome storage
- Never shared with third parties
- Exportable for your own analysis (Pro)
- Deletable at any time
Get Started with Reading Analytics
Ready to understand your reading habits?
- Install Readima
- Read a few articles using any reading mode
- Click the Readima icon and select "Dashboard"
- Watch your analytics populate in real-time
The more you read, the more insights you'll gain. Start tracking your reading journey today.
Related Features
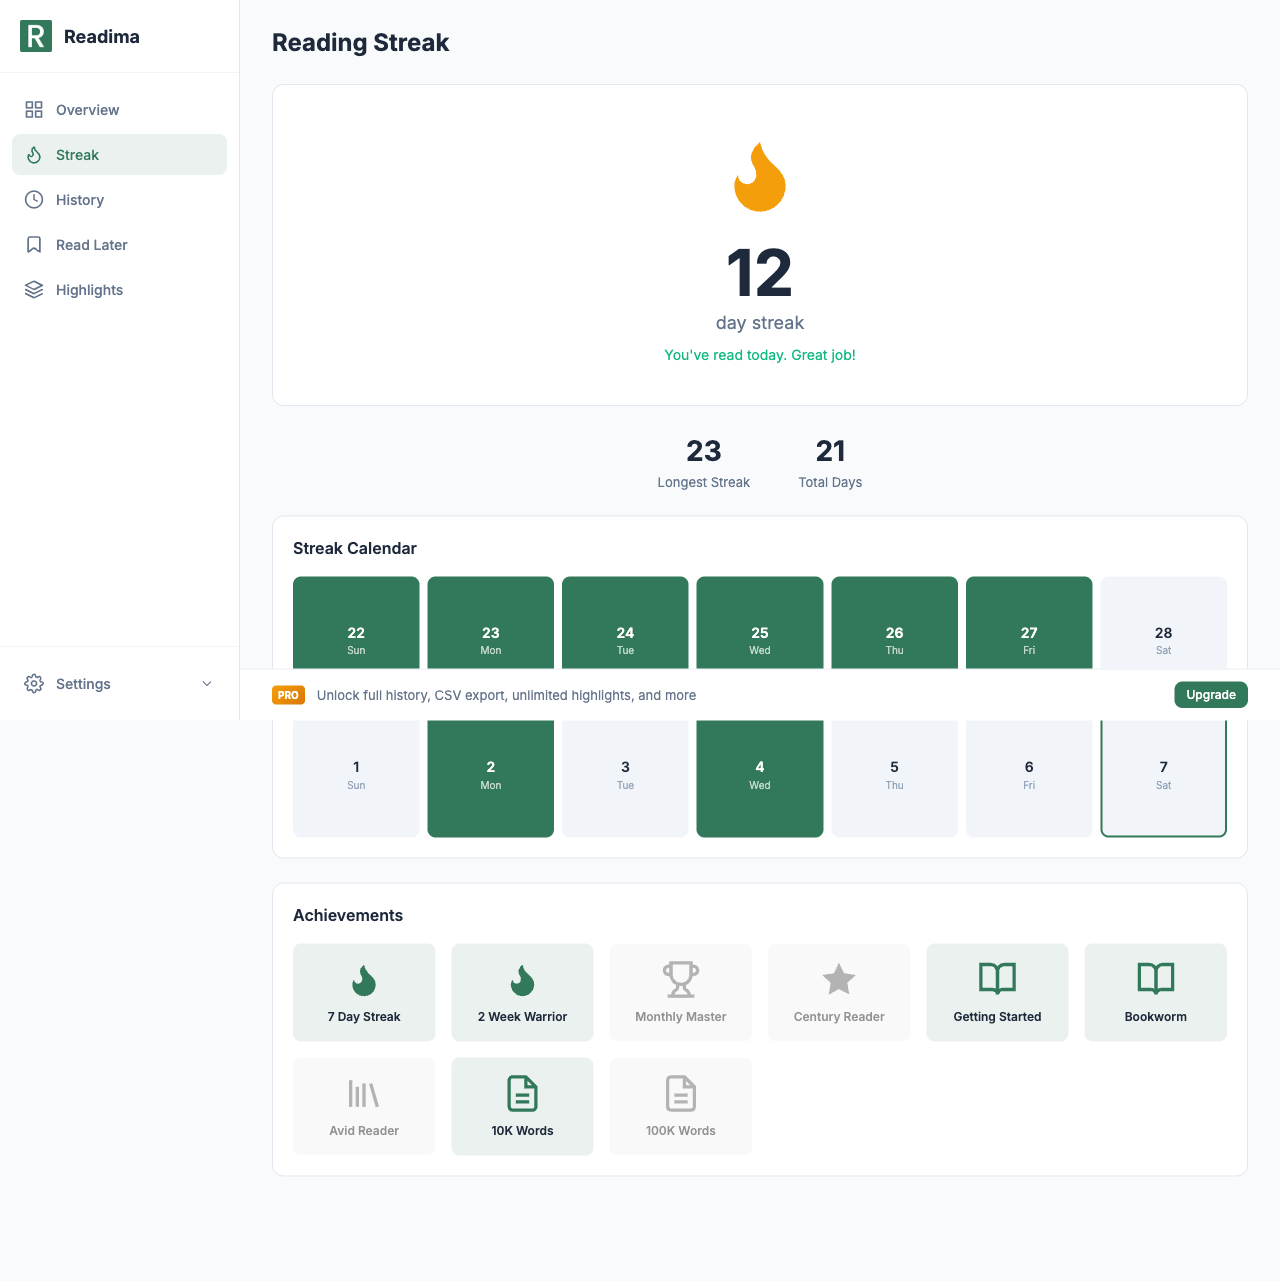
- Reading Streaks and Achievements - Gamify your reading habit
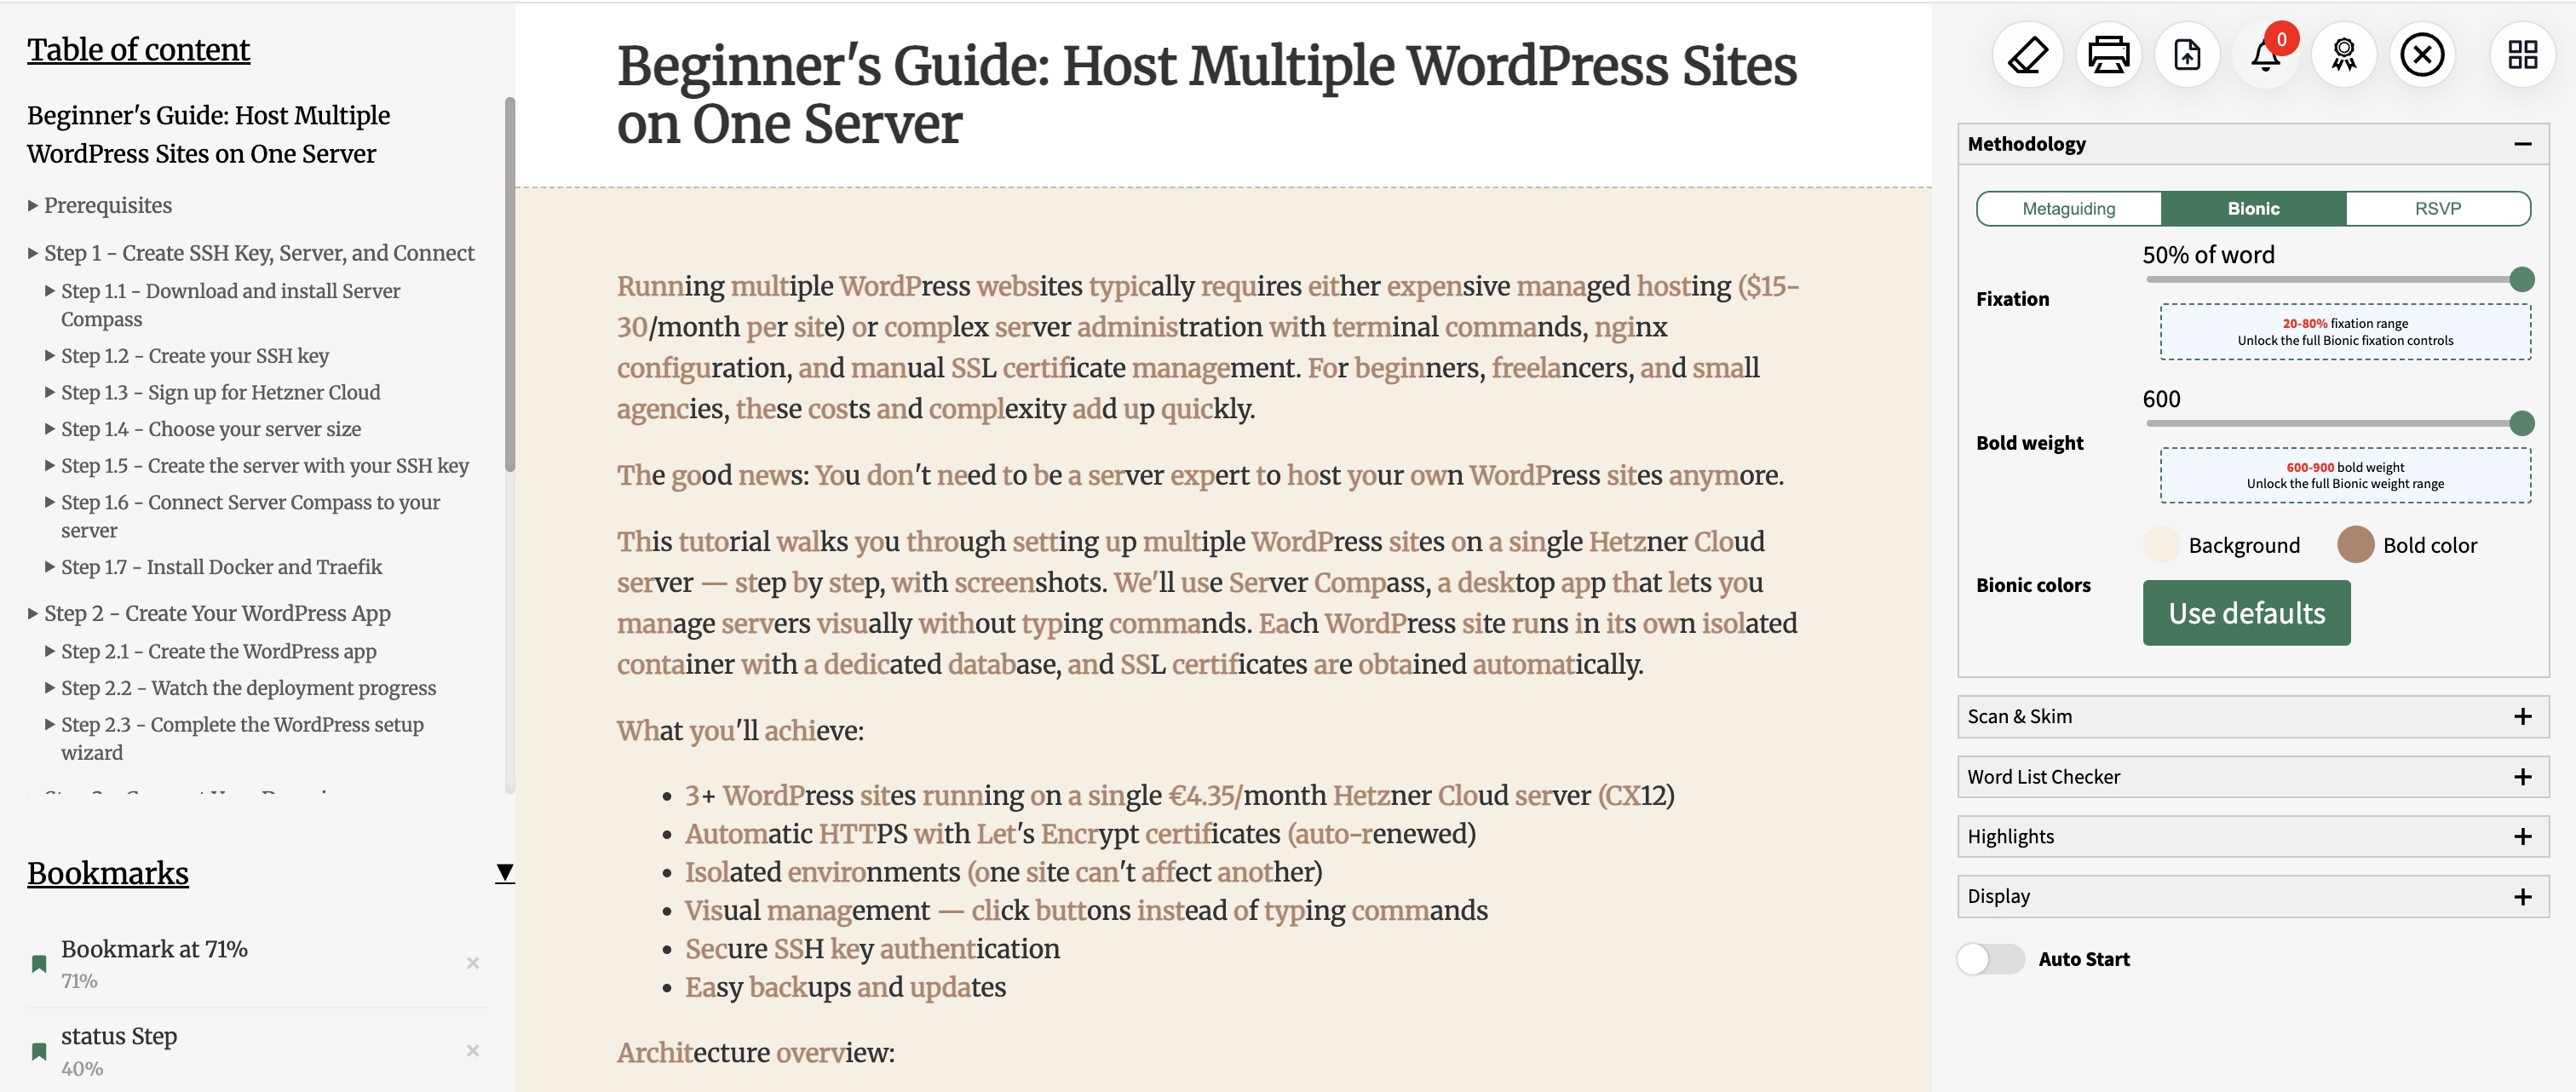
- Bionic Reading: Read 25% Faster - Improve your WPM
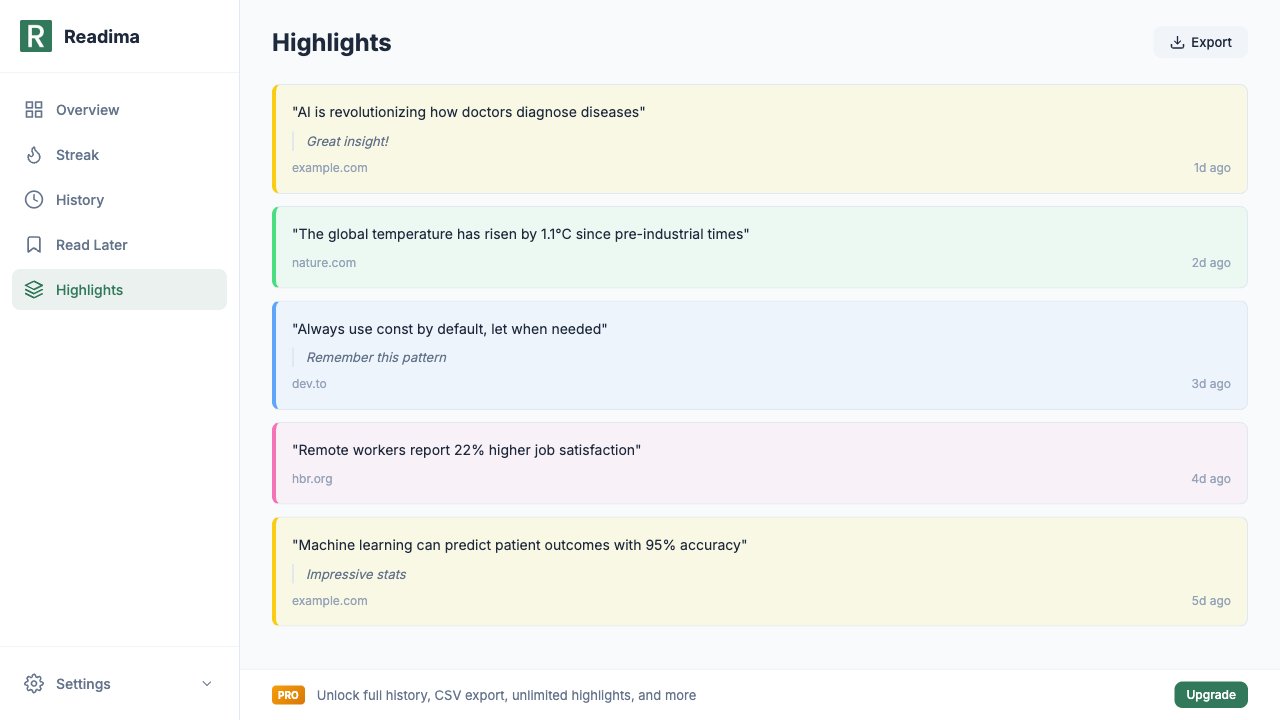
- Highlight and Annotate Articles - Save key insights
Start tracking your reading today! Download Readima for free and access your personal reading dashboard with WPM tracking, time saved calculations, and reading activity insights!
Want full history, CSV export, and 90-day analytics? Upgrade to Pro for just $2.9/month.
Related in the StoicSoft network
If you run monitoring, uptime checks, or alerting across self-hosted apps like the ones above, ServerCompass is the StoicSoft network's tool for wiring tiered severity, flap suppression, and low-noise alerts into a single dashboard.
Ready to Read Faster?
Join thousands of readers who use Readima to improve their reading speed and comprehension. Start your speed reading journey today.